IC Markets Home Sign in Web Trader Contact Us
IC Markets Social IC Markets Social

Information Hub for
Serious Traders

  • ABOUT US
  • OPEN LIVE ACCOUNT
  • OPEN DEMO ACCOUNT
  • TRADE NOW
  • VISIT OUR BLOG
IC Markets Social
  • ABOUT US
  • OPEN LIVE ACCOUNT
  • OPEN DEMO ACCOUNT
  • TRADE NOW
  • VISIT OUR BLOG
August 1, 2022European_Indexes_esIC Markets

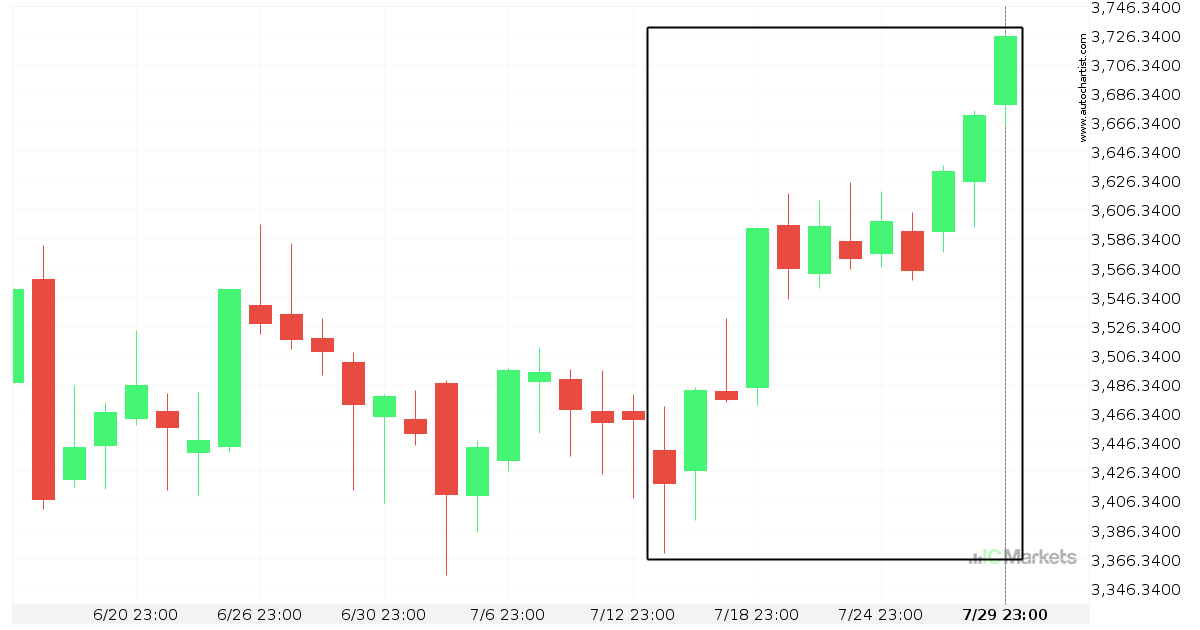
El EU Stocks 50 Index experimentó un movimiento excepcional

Para aquellos de ustedes que no creen en las tendencias, esta puede ser una oportunidad para aprovechar un excepcional movimiento de un 9% en EU Stocks 50 Index. Este movimiento ha ocurrido durante los últimos 17 días. Por otro lado, para aquellos que siguen las tendencias, deben considerar aprovecharse de esta.

Read more
July 29, 2022European_Indexes_esIC Markets

El France 40 Index está en dirección up

El France 40 Index ha experimentado un excepcional movimiento ascendente de un 8,67% de 5987.48 a 6376.12 en 25 días.

Read more
July 28, 2022European_Indexes_esIC Markets

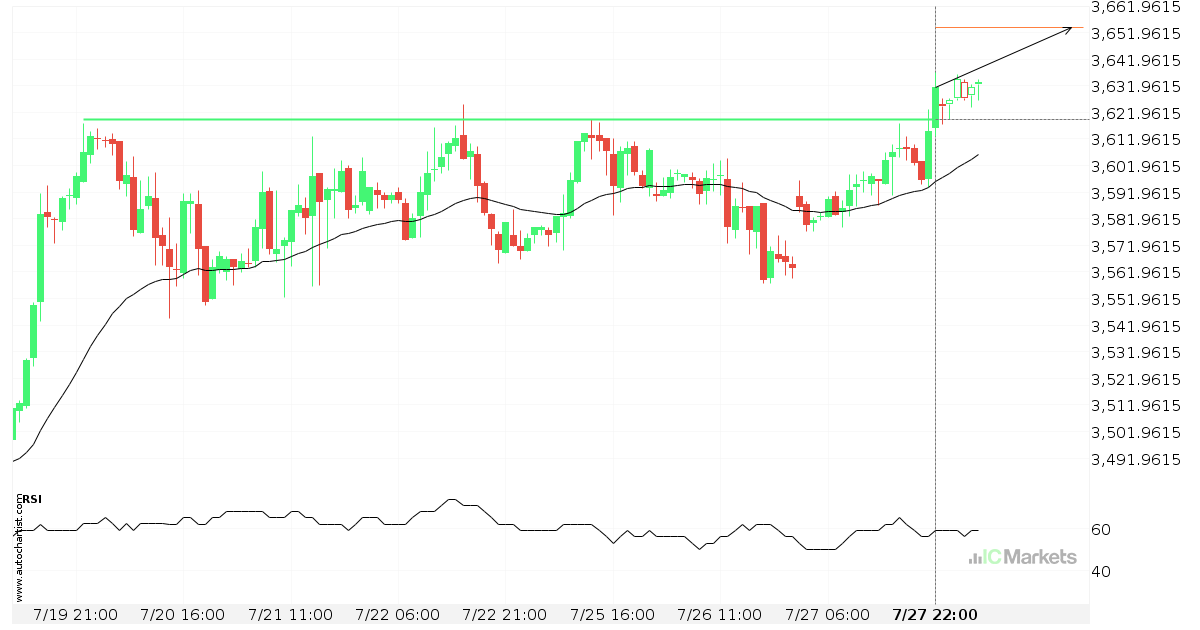
El EU Stocks 50 Index atravesó la importante línea de precio de 3619.2000

El EU Stocks 50 Index atravesó una línea de resistencia. Ha entrado en contacto con esta línea en numerosas ocasiones en los últimos 8 días. Esta irrupción muestra un movimiento potencial hacia el nivel de 3653.8101 dentro de las próximas 19 horas. Ya hemos observado un retroceso desde esta posición en el pasado, por tanto, […]

Read more
July 27, 2022European_Indexes_esIC Markets

El Japan 225 Index atravesó la importante línea de precio de 27719.0000

El Japan 225 Index atravesó una línea de resistencia. Ha entrado en contacto con esta línea en numerosas ocasiones en los últimos 7 días. Esta irrupción muestra un movimiento potencial hacia el nivel de 27875.0996 dentro de las próximas 2 días. Ya hemos observado un retroceso desde esta posición en el pasado, por tanto, debemos […]

Read more
July 26, 2022European_Indexes_esIC Markets

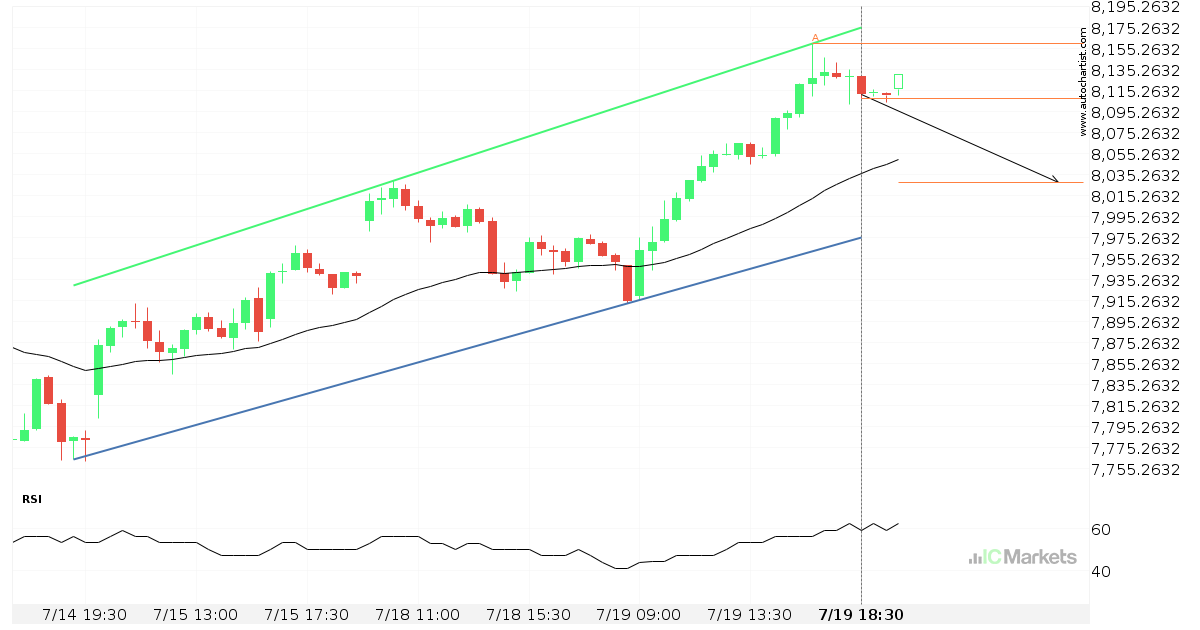
El EU Stocks 50 Index se aproxima a la resistencia de un Cuña ascendente

El EU Stocks 50 Index se está acercando a la línea de resistencia de un Cuña ascendente. Ha llegado a esta línea en numerosas ocasiones durante los últimos 18 días. Si vuelve a probarla de nuevo, debería hacerlo en las próximas 3 días.

Read more
July 25, 2022European_Indexes_esIC Markets

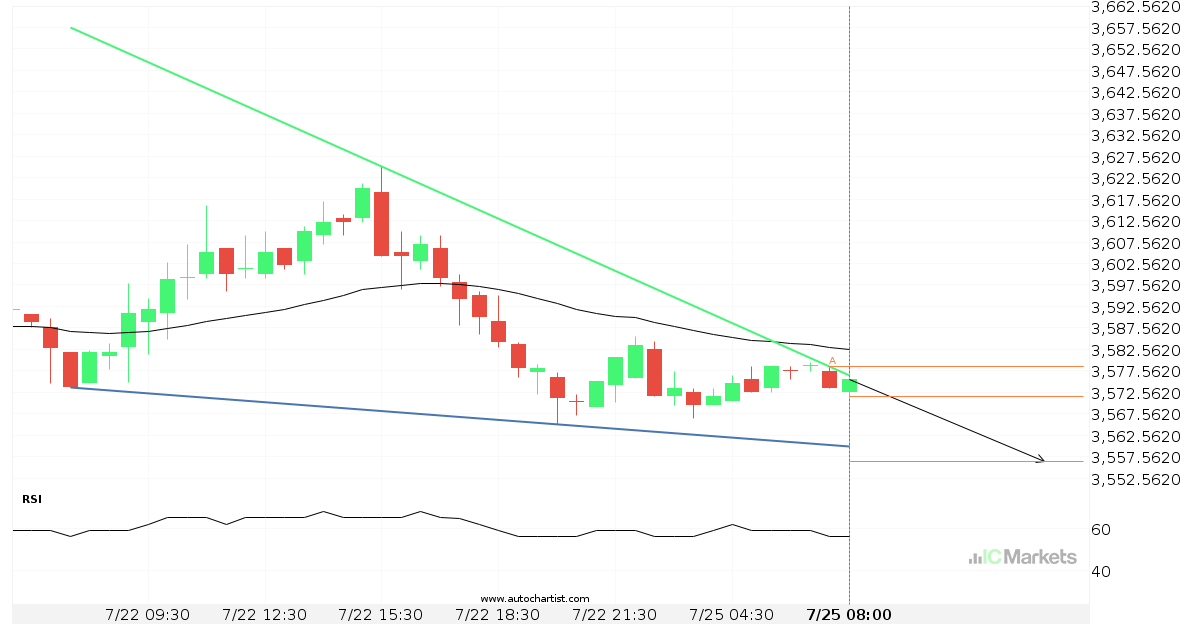
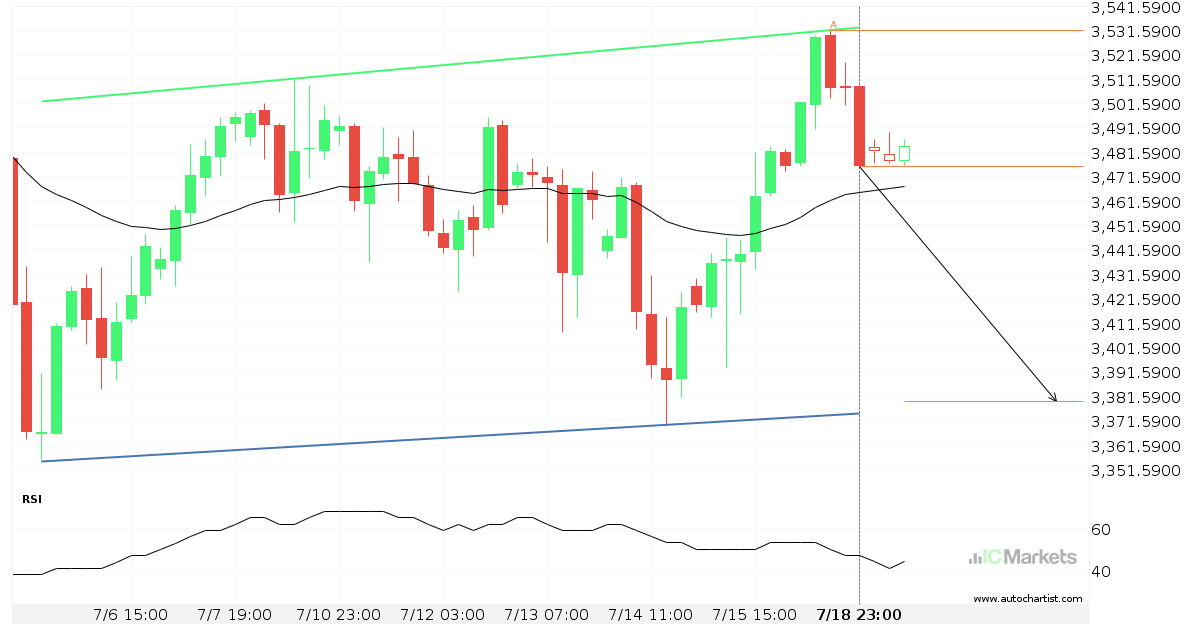
EU Stocks 50 Index – acercándose a el soporte del Cuña descendente

El EU Stocks 50 Index avanza hacia una línea de soporte. Como le hemos visto retroceder desde esta línea anteriormente, podríamos presenciar, o bien, una ruptura a través de esta línea o una recuperación a los niveles actuales. Ha llegado a esta línea en numerosas ocasiones en los últimos 4 días y puede probarla de […]

Read more
July 21, 2022European_Indexes_esIC Markets

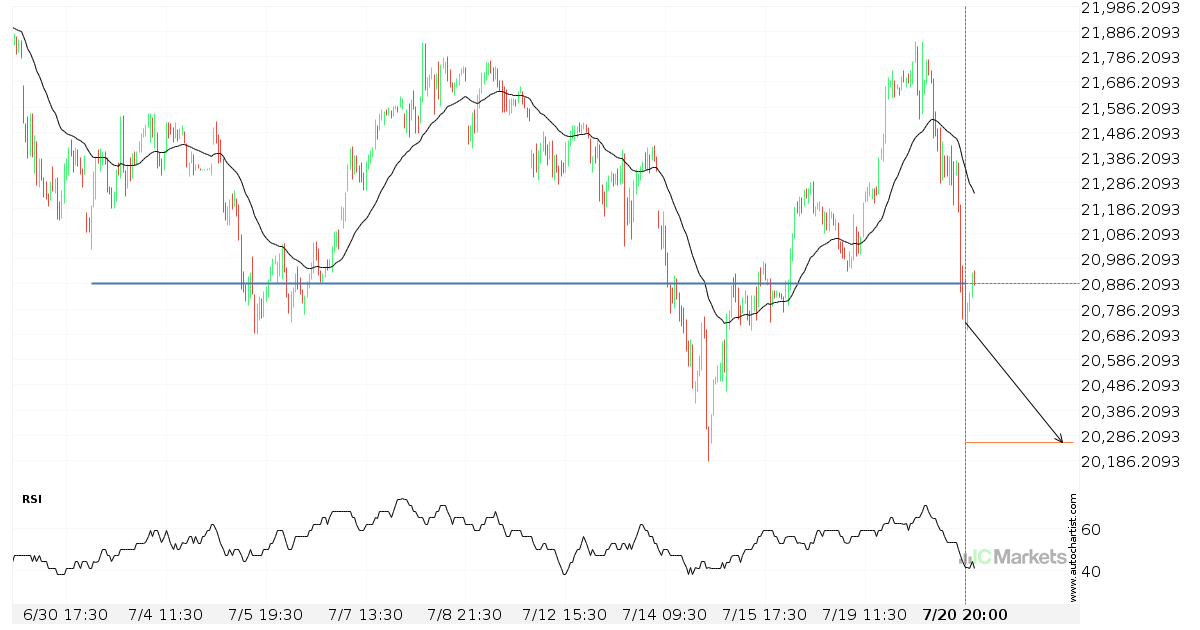
El Italy 40 Index atravesó la importante línea de precio de 20887.0000

El Italy 40 Index atravesó una línea de soporte. Ha entrado en contacto con esta línea en numerosas ocasiones en los últimos 20 días. Esta irrupción muestra un movimiento potencial hacia el nivel de 20257.7891 dentro de las próximas 2 días. Ya hemos observado un retroceso desde esta posición en el pasado, por tanto, debemos […]

Read more
July 20, 2022European_Indexes_esIC Markets

¿Tendrá el Spain 35 Index suficiente impulso como para irrumpir el soporte?

El Spain 35 Index se dirige hacia la línea de soporte de un Canal alcista y puede alcanzar este punto en las próximas 9 horas. Ha probado esta línea ya en numerosas ocasiones en el pasado, y esta vez no tendría porqué ser diferente y terminar con una recuperación en lugar de una irrupción. Si […]

Read more
July 19, 2022European_Indexes_esIC Markets

EU Stocks 50 Index – acercándose a el soporte del Canal alcista

El EU Stocks 50 Index avanza hacia una línea de soporte. Como le hemos visto retroceder desde esta línea anteriormente, podríamos presenciar, o bien, una ruptura a través de esta línea o una recuperación a los niveles actuales. Ha llegado a esta línea en numerosas ocasiones en los últimos 14 días y puede probarla de […]

Read more
July 18, 2022European_Indexes_esIC Markets

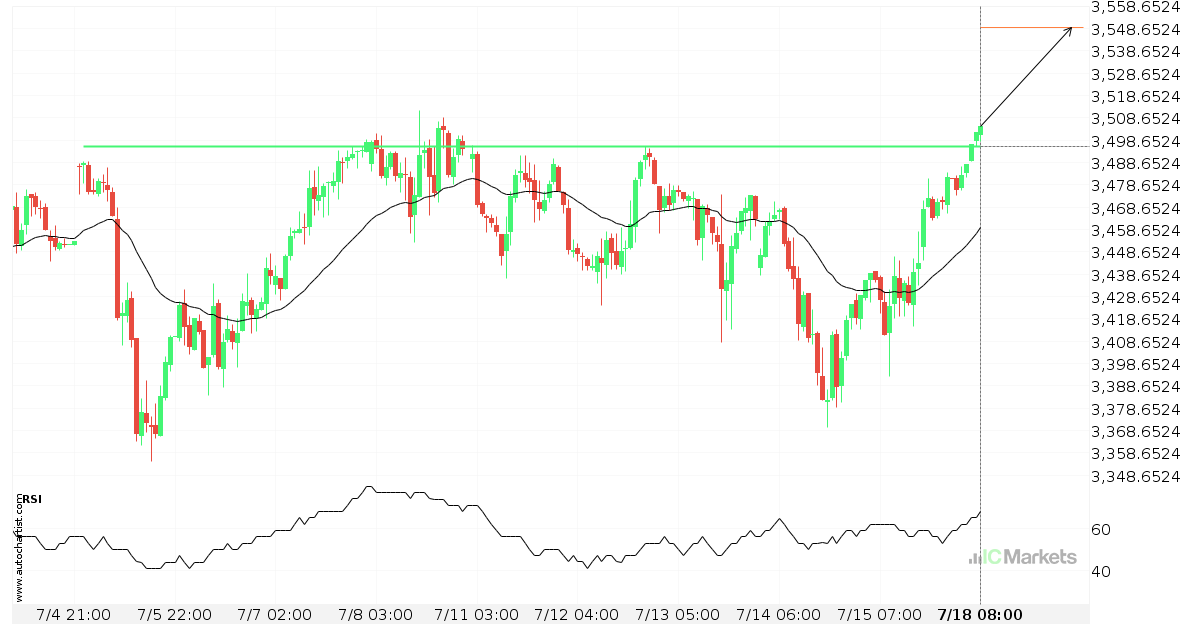
EU Stocks 50 Index – línea de precio psicológico atravesada

El EU Stocks 50 Index atravesó la línea de resistencia. Como ya lo hemos visto retroceder desde esta posición en el pasado, deberíamos esperar la confirmación de la ruptura antes de operar. Ha llegado a esta línea en numerosas ocasiones en los últimos 14 días, lo cual sugiere un posible nivel objetivo alrededor de 3548.9500 […]

Read more
  • 1
  • 2
  • 3
  • …
  • 50
  • 51
  • 52
  • 53
  • 54
  • 55
  • 56
  • …
  • 88
  • 89
  • 90

Recent Posts

  • US Wall Street 30 Index – المستوى الرئيسي – مقاومة
  • Brent Oil vs US Dollar – نموذج الرسم البياني – قناة صاعدة
  • Brent Oil vs US Dollar – نموذج الرسم البياني – قناة صاعدة
  • Hong Kong 50 Index – نموذج الرسم البياني – مثلث صاعد
  • Hong Kong 50 Index – รูปแบบกราฟ – สามเหลี่ยมขาขึ้น

Recent Comments

    Translation


     Edit Translation

    Trade with

    a market leader you can rely on

    Open Trading Account Try a Free Demo

    Forex Trading

    • Accounts Overview
    • Open an Account
    • Launch Web Trader

    Trading Specifications

    • Spreads and Commissions
    • Range of Market
    • Trading Hours
    • Funding
    • Withdrawal

    About IC Markets

    • Help Center
    • Why IC Markets
    • Regulation
    • Legal Documents
    • Contact Us


    Forex Trading

    • Accounts Overview
    • Open an Account
    • Launch Web Trader

    Trading Specifications

    • Spreads and Commissions
    • Range of Market
    • Trading Hours
    • Funding
    • Withdrawal

    About IC Markets

    • Chat with a Specialist 24/7
    • Why IC Markets
    • Regulation
    • Legal Documents
    • Contact Us

    Disclaimer: This material is marketing material where all marketing material is published for informational purposes only. This material does not contain and should not be considered as containing - investment advice and recommendations, or suggestions for performing any actions with financial instruments. The built-in widgets belong to their external independent authors, and IC Markets is not responsible for their content and their impact on trade.

    All content rights reserved. Opinions of the authors may not coincide with the opinion of the blog editors. When copying materials from this site or connecting to an RSS feed to republish our articles, a link to IC Markets or attribution in the format ‘IC Markets Blog’ is required. For general questions, please contact the editorial office via the form on the Contact us page.

    Risk Warning: Trading Derivatives carries a high level of risk to your capital and you should only trade with money you can afford to lose. Trading Derivatives may not be suitable for all investors, so please ensure that you fully understand the risks involved and seek independent advice if necessary. A Product Disclosure Statement (PDS) should be considered before entering into a transaction with us.

    The contents of this page are general information only and does not take into account your personal situation, financial objectives or needs. It is up to you to make sure the products that we offer suit your specific needs. You should not trade with us unless you understand the features and risks of the products that we offer. This means that you might need to seek independent advice before you start trading with us.

    © 2022 Raw Trading Ltd | All rights reserved.
    • Sample Page